Modeling the Dashboard Provenance
Johne Jarske, Jorge Rady, Lucia V. L. Filgueiras, Leandro M. Velloso, Tania L. Santos
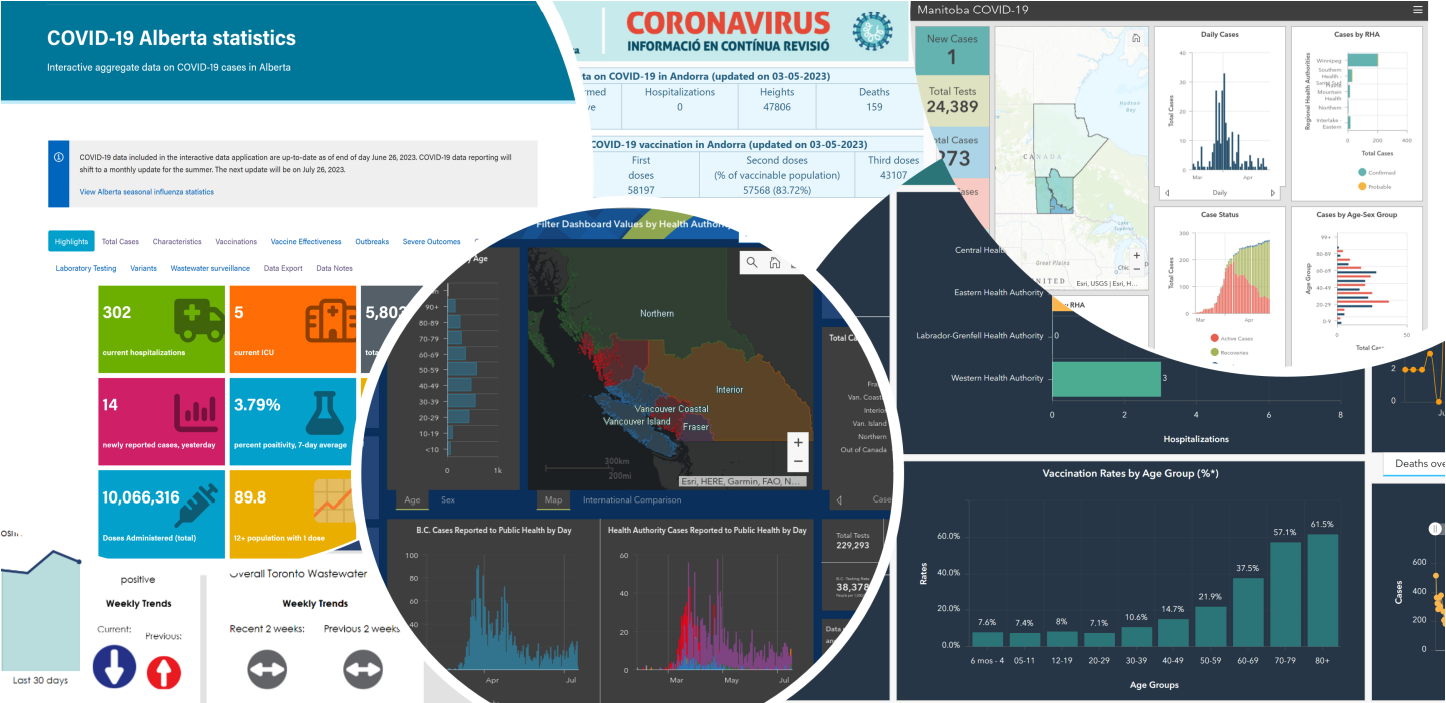
Organizations of all kinds, whether public or private, profit-driven or non-profit, and across various industries and sectors, rely on dashboards for effective data visualization. However, the reliability and efficacy of these dashboards depend on the quality of the data they present. Studies show that less than a quarter of dashboards provide information about their sources, which is just one of the expected metadata when provenance is seriously considered. This paper aims to provide a provenance representation model specifically designed for dashboards that entitles standardization, modeling, generation, capture, and visualization. The proposed model will offer a comprehensive set of essential provenance metadata that enables users to evaluate the quality, consistency, and reliability of the information on the dashboards. This will allow a clear and precise understanding of the context in which a specific dashboard was developed, ultimately leading to better decision-making.
Read the Full Paper
Visualising category recoding and redistributions
Cynthia A Huang
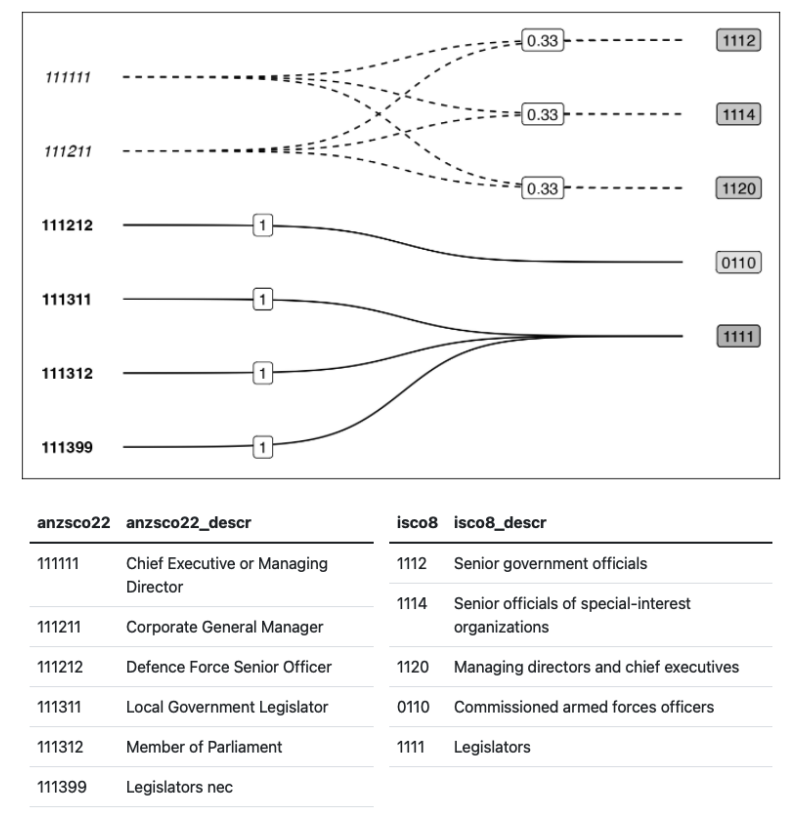
This paper proposes graphical representations of data and rationale provenance in workflows that convert data between distinct but semantically related nomenclature. We motivate the graphical representations with a new task abstraction, the Nomenclature Transformation, and associated graph-based information structure, the Crossmap. The structure is illustrated using an example of converting numeric statistics from a country-specific nomenclature to an international classification standard, a common task in ex-post data harmonisation. Crossmaps support the separation of domain expertise and categorical mapping decisions from the specifics of data manipulation. We discuss the opportunities and challenges of using visualisation to audit and communicate nomenclature transformations and present candidate graphical representations.
Read the Full Paper